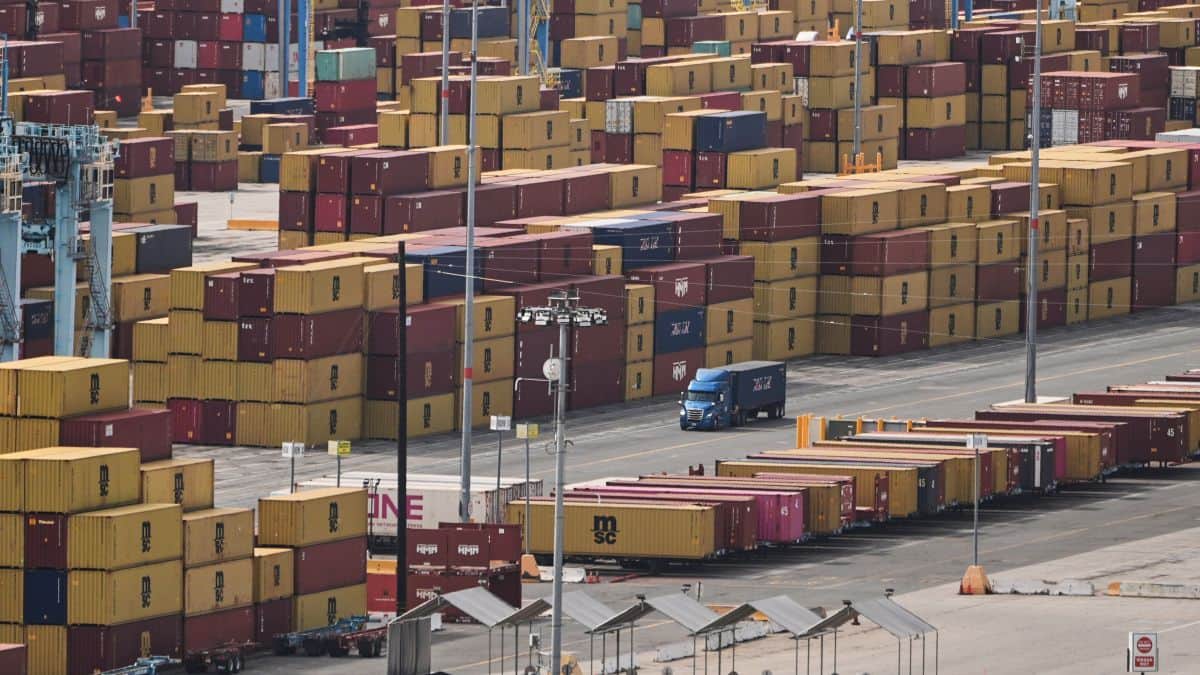
The American consumer is still buying, but the gears of global trade are beginning to grind against a new, uncomfortable reality. In February, containerized imports into the United States dropped by 6.5% compared to the previous month. On the surface, a mid-winter dip in cargo volume looks like a standard seasonal correction. It isn't. While the total volume of 2.14 million twenty-foot equivalent units (TEUs) remains high by historical standards—the fourth-highest February on record—the numbers mask a fundamental shift in how goods reach our shores and who is winning the logistical arms race.
We are witnessing the exhaustion of the post-pandemic surge. For three years, the supply chain was defined by a desperate, "get it here at any cost" mentality. That era is dead. What has replaced it is a fragmented, high-stakes game of geographic hedging. The 6.5% slide is not a sign of a collapsing economy; it is a sign of a rebalancing one. Companies are no longer stockpiling inventory with reckless abandon. Instead, they are navigating a world where the Suez Canal is a no-go zone and the Panama Canal is drying up, forcing a massive rerouting of the world’s wealth.
The Illusion of the February Slump
To understand why the 6.5% drop is deceptive, you have to look at the Lunar New Year. Production in China effectively hits a wall during this period, creating a natural lag in trans-Pacific shipments. However, even with that factored in, the baseline for "normal" has been permanently raised. We are comparing current volumes against a pre-2020 world that no longer exists.
The real story is found in the ports of the East and Gulf Coasts. For decades, the West Coast—specifically Los Angeles and Long Beach—was the undisputed king of American imports. That dominance is eroding. As labor tensions simmer and shippers seek to avoid the bottleneck of the San Pedro Bay, the market share is migrating. In February, while overall volumes dipped, the top East and Gulf Coast ports saw their share of total US imports hold steady at roughly 44%.
This isn't just a tactical move. It is a strategic retreat from over-reliance on a single point of failure. Importers are paying a premium to send goods through the Suez Canal or around the Cape of Good Hope just to ensure their products don't get stuck in a California rail yard. This geographic diversification is expensive, inflationary, and increasingly permanent.
The Panama Bottleneck and the Red Sea Chaos
The logistics industry is currently fighting a war on two fronts. In the West, the Panama Canal is strangled by a historic drought. Low water levels have forced the canal authority to slash the number of daily transits. In the East, Houthi rebels in the Red Sea have turned one of the world’s most vital waterways into a shooting gallery.
These aren't just "challenges." They are systemic shocks.
When a ship cannot pass through Suez, it adds ten to fourteen days to its journey by sailing around Africa. That delay removes capacity from the global market. A ship that is stuck at sea for an extra two weeks is a ship that isn't at a pier being loaded for its next trip. This creates an artificial scarcity of containers, driving up spot rates even when consumer demand is technically softening.
Transit Time Volatility
| Route | Pre-Disruption Days | Current Average Days | Cost Increase (Est.) |
|---|---|---|---|
| Shanghai to New York (Suez) | 32 | 46 | 25% |
| Shanghai to Savannah (Panama) | 35 | 42+ | 15% |
| Shenzhen to Los Angeles | 18 | 21 | 10% |
The data from February shows that transit delays to East Coast ports are worsening. The average delay for the port of Savannah reached nearly 10 days, a significant jump from late last year. Shippers are caught in a pincer move: stay with the West Coast and risk labor instability, or move to the East Coast and face the unpredictability of global maritime chokepoints.
The Consumer Spending Paradox
If imports are falling, why does it feel like the economy is still running hot? The answer lies in the composition of those containers. We are seeing a move away from "big box" panic-buying toward high-velocity consumer goods.
Retailers learned a painful lesson in 2022 when they were left holding billions of dollars in "dead" inventory—bulky furniture and home office equipment that people no longer wanted once they left their Zoom rooms. Today’s containers are packed more efficiently and with items that have a higher turnover rate.
The Federal Reserve's battle with inflation is the silent hand behind these numbers. High interest rates have made it more expensive for companies to hold inventory on credit. The "Just in Case" model that emerged during the pandemic is being trimmed back toward a modified "Just in Time" strategy. The 6.5% drop in imports reflects a corporate America that is finally getting its inventory-to-sales ratios back under control. They aren't buying less because people are poor; they are buying less because they are finally becoming efficient again.
Port Labor and the Looming Shadow of 2024
There is a monster under the bed that most analysts are ignoring. The contract for the International Longshoremen’s Association (ILA), representing workers at East and Gulf Coast ports, expires in September. The union leadership has been vocal, even aggressive, about their demands. They have seen the record profits the ocean carriers made during the pandemic, and they want their cut.
This creates a massive "pull-forward" effect. Smart logistics directors are looking at the February numbers and realizing they need to get their peak season goods into the country before the summer ends. If the East Coast shuts down in October, the West Coast will not be able to handle the overflow. We would see a repeat of the 2021 gridlock, but with even higher stakes.
The February volume, while lower than January, is still 23.3% higher than February 2023. This is the "high floor" phenomenon. Even in a "down" month, the volume is staggering. The infrastructure is being pushed to its limit, and there is zero margin for error. One strike, one more canal closure, or one major cyberattack on a terminal operating system could send the entire house of cards tumbling.
The China Question and the Rise of the "Alt-Asia"
The dominance of Chinese manufacturing is being nibbled away at the edges. While China still accounts for the lion's share of US container imports—roughly 37% in February—the growth is happening elsewhere. Vietnam, India, and Thailand are picking up the slack.
This shift complicates the logistics landscape. Shipping from Southeast Asia to the US East Coast is a different beast than the straight shot from Shanghai to Long Beach. It requires more transshipment points and more complex carrier alliances. The drop in February imports from China was sharper than the drop from other Asian nations. This suggests that the "de-risking" talk from C-suites is finally translating into actual shipping manifests.
Port Performance and the Tech Gap
Not all ports are created equal. The difference between a 12-hour turn time for a truck and a 4-hour turn time is the difference between profit and loss for a regional distributor. February’s data highlights a growing performance gap.
Ports like Virginia and Charleston have invested heavily in automation and inland rail ports. They are absorbing the diverted cargo from the Panama Canal crisis better than their neighbors. Conversely, ports that have lagged in technology are seeing their dwell times—the amount of time a container sits on the dock—climb steadily.
The winners in this new era will be the ports that treat data as seriously as they treat diesel. Real-time visibility into container status is no longer a luxury; it is the baseline requirement for any company trying to manage a supply chain through two active war zones and a climate crisis.
The Hidden Cost of Reliability
As we move into the second quarter, the cost of ocean freight is the metric to watch. Spot rates have softened slightly from their January peaks, but they remain significantly higher than they were a year ago. The "Red Sea Surcharge" is now a standard line item on invoices.
Companies are faced with a brutal choice. They can absorb these costs and take a hit to their margins, or they can pass them on to a consumer who is already weary of "greedflation." In February, we saw the first signs of companies choosing the former, hoping that the disruptions would be short-lived. That hope is fading.
The supply chain is not "returning to normal." It is being forged into something more expensive, more complex, and more regional. The 6.5% drop in imports is the sound of the system taking a breath before the next upheaval.
Audit your lead times now. If you are still planning your supply chain based on 2019 transit windows, you are already behind. The fourth-highest February on record proves the volume is there, but the 6.5% monthly drop proves the volatility is here to stay. Diversify your entry points, hedge your carrier contracts, and stop waiting for the waters to calm. They won't.